Professional NBA Totals Betting Strategy for UK Markets
 Available in US
- High-Scoring Environments: Analyzing 240-Point Over Under Totals Strategies
- Pace is not what most people think it is
- Offensive efficiency is the multiplier
- The variance question that bettors ignore
- Why totals are sharper than spreads
- The pace-up game that fools the market
- First half totals and where to find value
- The pace-and-efficiency lies referees tell
- The fatigue layer the market underprices
- The discipline that separates totals bettors
High-Scoring Environments: Analyzing 240-Point Over Under Totals Strategies
I once stayed up until 5am watching a Pelicans game finish 73-70 against the Magic. The total had been 226.5. I had taken the under at 227 the morning of the game and watched both teams shoot a combined 32 percent. The win was 50 quid. The lesson was worth a thousand. NBA totals are not a coin flip on whether a game goes high or low – they are a market specifically about pace, efficiency, and the variance between the two teams’ offensive identities. Most UK bettors who lose money on totals lose it because they do not separate those three factors.
The 2025-26 NBA season is running at 101.9 possessions per 48 minutes and averaging 117.7 points per game. That is the highest scoring environment in NBA history. The total line for an average game is around 230 to 235. If you do not understand why, you cannot consistently bet this market.
Pace is not what most people think it is
Pace is possessions per 48 minutes. Every NBA possession that ends in a made basket, a missed shot, a turnover, or a defensive rebound counts as one possession. Both teams play the same number of possessions in a game, give or take a few from end-of-quarter scenarios. Pace is the rate at which those possessions happen.
A game between two top-five pace teams will produce 105 to 110 possessions per side. A game between two bottom-five pace teams will produce 95 to 100. That 10-possession-per-team gap, at modern offensive efficiency of roughly 115 points per 100 possessions, is the difference between a 232 total and a 217 total. Pace is the single most predictive variable in NBA totals modelling, and most casual bettors underweight it badly.
The mistake people make is assuming pace is about playing fast. It is not. Pace is about how quickly each team’s offensive actions end – fast teams attack early in the shot clock, slow teams burn clock through complex sets. A team that grinds out 14-second possessions is slow regardless of whether they are running. Pace measures the clock, not the apparent speed of play.
Offensive efficiency is the multiplier
Once you know how many possessions a game will have, you multiply by points-per-possession to get the projected total. League average in 2025-26 is roughly 115 points per 100 possessions. The best offences run at 120-plus. The worst offences run at 108 to 110.
The trap is to use season-long averages. Offences fluctuate week to week based on health, fatigue, opponent, and scheme adjustments. A team running at 120 efficiency over the last 10 games is much more relevant than a team at 117 over the season. Rolling averages capture momentum that season averages bury.
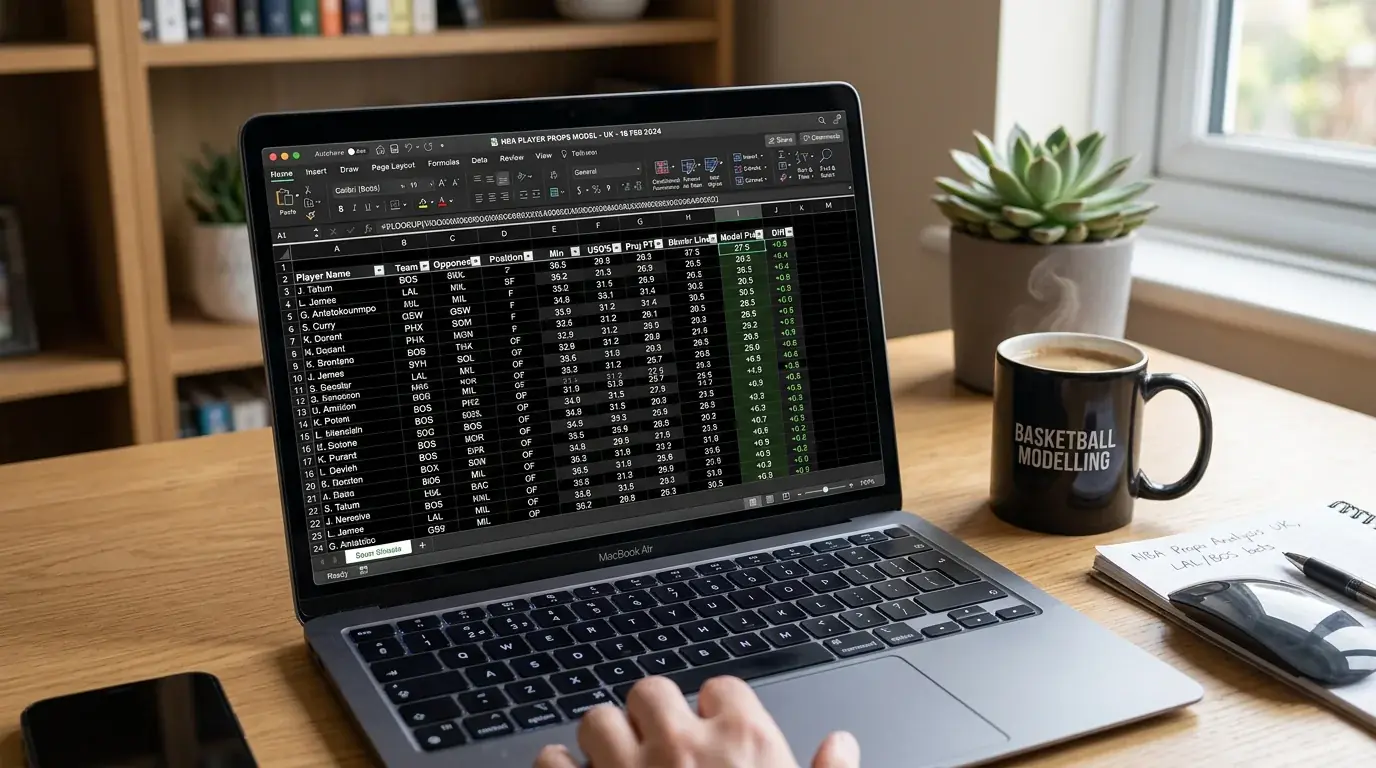
Defensive efficiency is the other side of the same calculation. A great offence against a great defence is not a high-total game – the defence drags the offence’s per-possession output down. The total prediction is: pace projection times the average of (Team A offence vs Team B defence) and (Team B offence vs Team A defence). That four-input formula is the basic equation. Everything else is refinement.
The variance question that bettors ignore
Even a perfect projection has variance around it. If your model says the total should be 228, the actual game will distribute around that number – sometimes 215, sometimes 245, occasionally further. The line you are betting against has its own variance assumption built in. Your edge is only meaningful if it exceeds the noise level of NBA scoring, which is substantial.
A practical implication: do not bet a total at half a point of edge. The variance swamps that edge over short samples. I look for two and a half points or more of disagreement between my projection and the line before I take a position, which means I bet fewer totals than I project. That selectivity is the difference between handicapping for entertainment and handicapping for money.
The other implication: alternate totals – the over 220 instead of the over 230 – usually carry too much vig for their reduced risk to be worth it. Books mark up alternate lines aggressively because casual bettors love them. Stick to the main number unless you have a specific reason to ladder.
Why totals are sharper than spreads
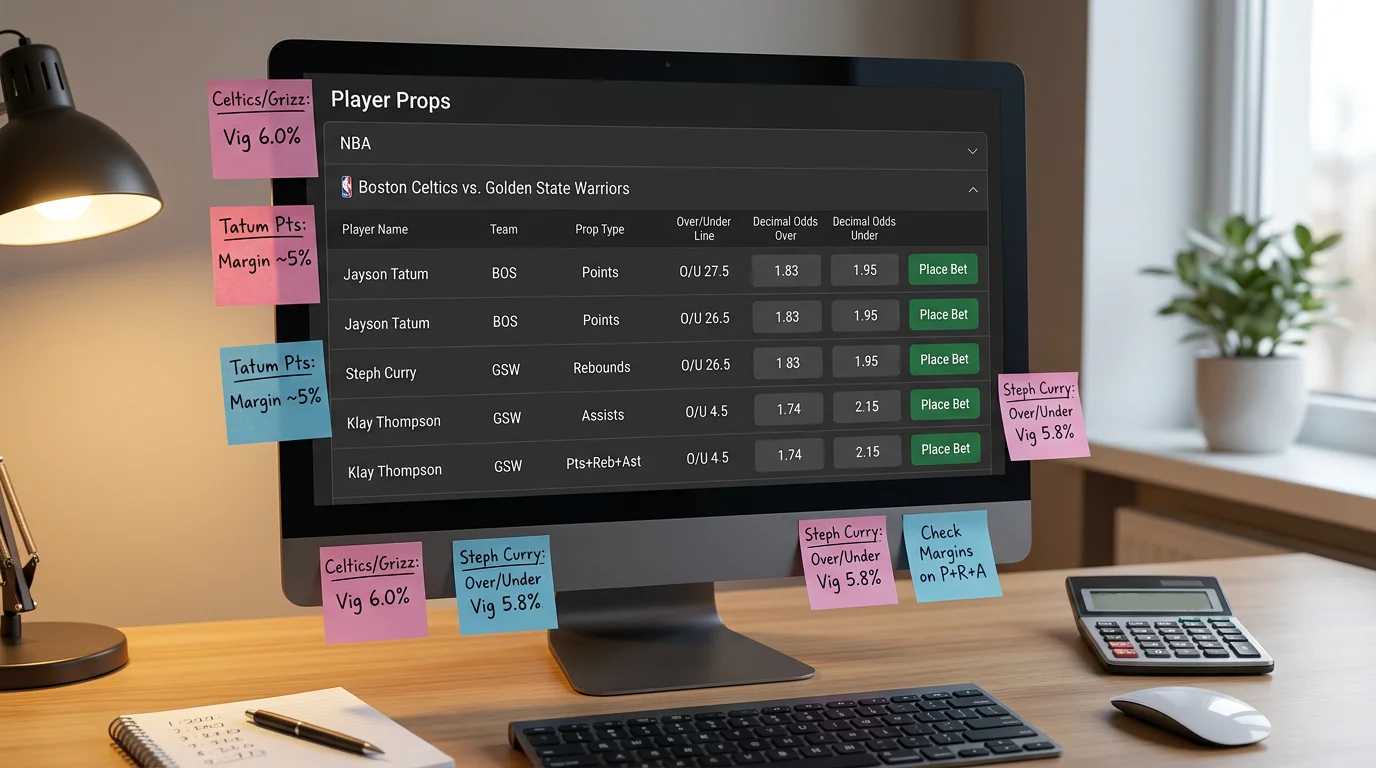
The NBA totals market attracts disproportionate sharp money because totals models are more publicly accessible than spread models. Pace and efficiency data are league-standard metrics that any serious bettor can pull. The implication is that totals lines are tighter, harder to beat, and less generous to recreational bettors than spreads are.
I see this in my own results. My spread bets carry significantly higher edge per bet than my totals bets, despite spreads being intuitively harder to analyse. The market reflects that intuition by making spreads softer and totals tighter. Recreational bettors think they understand spreads better; sharp money flows where the inefficiency is, and the inefficiency is in spreads.
That does not mean avoid totals. It means accept that totals require more precision for less reward, and weight them accordingly in your betting portfolio. The bettors who hit totals consistently are working harder for thinner edges than the bettors hitting spreads.
The pace-up game that fools the market
There is a specific situation where totals markets misprice: a slow team playing a fast team. The convention is to average the two teams’ paces, but games between teams of different paces actually produce paces closer to the fast team’s number, because the slow team cannot fully impose its grinding style on a team determined to run. The market sometimes prices these games at the midpoint when the reality is 2 to 3 possessions higher.
Identifying these games is straightforward: look for a team in the top five of pace facing a team in the bottom ten. Project the pace 2 possessions per team above the simple average. If the line is built on the simple average, you have an edge on the over.
This is not a guaranteed edge – variance can still kill any specific bet. But the pricing inefficiency is real and has persisted across multiple seasons in my tracking. Pace asymmetry is one of the few NBA totals patterns that has not been fully corrected by sharper books.
First half totals and where to find value
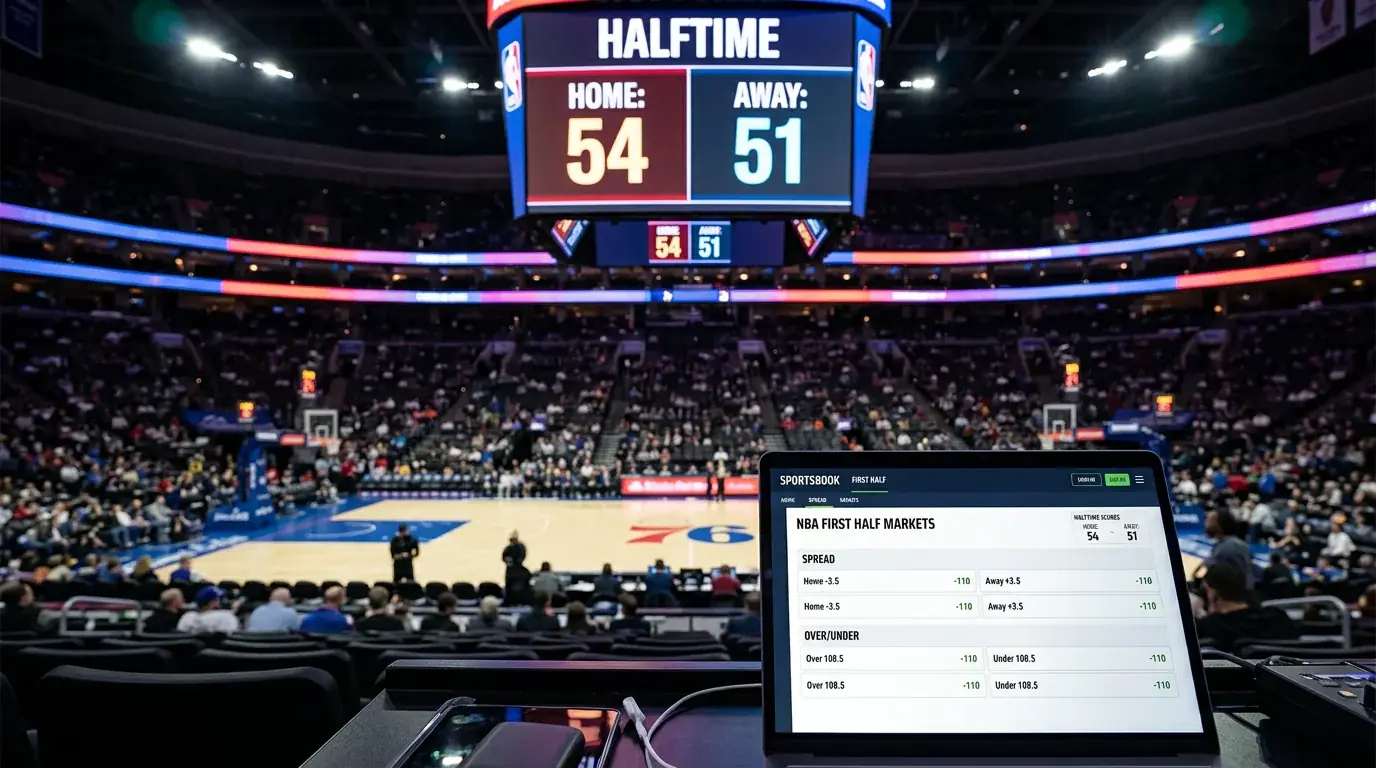
First half totals trade at roughly 52 percent of the full-game number, because teams score slightly more in the second half due to comeback efforts and free throw rate increases at the end of games. The relationship is stable enough that you can use the full-game line as a starting point for the first half projection.
Where first half totals get interesting: blowout candidates. If a team is a heavy favourite and is likely to lead by 20-plus going into the second half, both teams will reduce pace and intensity. Starters sit, garbage time arrives, scoring slows. The full-game total might land but the first half total often goes over because both teams played seriously for 24 minutes.
Conversely, two evenly matched defensive teams will play a low-scoring first half before opening up in the second half. The full-game total stays in range but the first half goes under. These directional patterns produce edges if you are willing to do the work to identify them, and they pair well with the granular matchup analysis I rely on when building per-player projections for the same games.
The pace-and-efficiency lies referees tell
Referee crews vary measurably in how many fouls they call per game, and foul calls drive free throw rate, which drives scoring. The data is published. Certain crews consistently produce higher-scoring games not because the teams play differently but because the free throw count is 8 to 12 higher than average.
This is a market inefficiency hiding in plain sight. The crews are typically posted a few hours before tip-off. UK bettors with a small spreadsheet of crew tendencies can pick up small edges on totals when the assignment is a strong outlier in either direction. The edge is not enormous and the data is noisy, but it is one of the few inputs available to retail bettors that the books do not fully integrate.
Caveat: do not overfit to crew data over short samples. A single crew having a high-scoring streak across 8 games tells you very little. Look at career numbers and accept that the signal is weak and additive, not primary.
The fatigue layer the market underprices
Teams on the second game of a back-to-back score 2 to 4 points fewer on average than their season average suggests. They also concede 1 to 2 points more. The net effect on totals is roughly neutral on most games but skewed toward the under in specific circumstances – teams that rely on perimeter shooting suffer more from fatigue than teams that rely on attacking the rim. Tired legs miss threes.
A heavy-three-point team on the second night of a back-to-back, especially on the road, is a strong under candidate. The market knows about the fatigue effect but applies it broadly. The specific case of a perimeter-dependent offence in this spot is consistently mispriced in my experience.
Build a small filter for this: identify the team’s three-point attempt rate, identify whether they are in a back-to-back on the road, identify if the total line has moved appropriately. If the line has not adjusted enough, the under is the bet. This is not a high-volume strategy – you might find 15 to 20 spots a season – but the hit rate is good.
The discipline that separates totals bettors
NBA totals reward bettors who are patient, mechanical, and accept that variance will produce ugly stretches even within winning systems. The over hits more often in modern NBA than the under – a function of the pace and scoring environment – but bettors who bet overs reflexively lose more than bettors who develop a model and bet both sides selectively. The market knows the over bias and prices around it.
My approach: project the total, compare to the line, bet only when the edge is meaningful, accept that a quarter of my bets will lose to obvious bad luck, and trust the process across a season rather than a week. The bettors who survive totals markets in the long run are the ones who treat it as an exercise in patience rather than an exercise in conviction. Conviction can be wrong. Patience compounds.
What is the average NBA total in the 2025-26 season?
Around 230 to 235 for the typical game, reflecting the league’s 117.7 points-per-game average and the pace environment of roughly 101.9 possessions per 48 minutes.
Are overs or unders more profitable in modern NBA?
Neither is structurally more profitable – the market prices around the over-bias of public bettors. The edge comes from identifying specific situations where the line has not adjusted enough, not from a blanket preference.
How much edge should I require before betting a total?
At least two to two and a half points of difference between your projection and the line. Variance in NBA scoring is too high to bet smaller edges with confidence.
Published by the nba bet of the day team.