Real NBA Point Spread Betting for UK Punters
 Available in US
- NBA Handicap Odds: Finding the Only Honest Line on the Board
- How the spread works at UK bookies, in plain English
- The key numbers that actually matter on NBA spreads
- Home-court advantage, recalibrated for the modern NBA
- Line movement and what sharp action actually looks like
- Alternate spreads and buying points: when the maths actually works
- Reading ATS records: signal, noise, and the small-sample trap
- Playoff spread dynamics: when the regular-season model breaks
- What the spread teaches a UK punter, in the end

NBA Handicap Odds: Finding the Only Honest Line on the Board
I have lost count of how many times a friend has texted me “Lakers are great this year, easy bet tonight” and asked nothing else. Easy bet at what price, mate? Because the Lakers being great is already in the number. The point spread is the bookmaker’s distilled opinion of how much better one team is than the other on the night, accounting for venue, rest, and every other variable they have priced in. Your job is not to identify the better team. Your job is to identify whether the better team is better by more or less than the handicap says.
Over the last decade in this market I have watched the gap between the casual view of an NBA matchup and the actual spread shrink dramatically. UK books used to be slower than the sharp US market on NBA — soft openers, late line adjustments, an exploitable lag. That has largely vanished. The closing line at a UK book on a primetime NBA game is now a serious number, priced against syndicated data and sharp action from across the Atlantic. The home spread on a typical matchup is now hovering around just 2.05-2.10 points, where it used to sit nearer to 3.5. The number itself is telling you that the league has changed.
Part of the reason UK spread pricing has sharpened is volume. Alex Green, the managing director of Prime Video Sport International, put it plainly when the audience numbers came out for the first NBA season on Prime: “These record audiences on Prime Video demonstrate an untapped demand for the NBA in Europe, and we saw that passion once again in London. Audiences are consistently tuning in and making the NBA on Prime a part of their weekly sports schedule.” More UK eyes on the games means more UK money in the markets, and more UK money means sharper pricing. The days of the lazy soft NBA opener on a Wednesday night are mostly behind us.
This piece is for the UK punter who wants to treat the spread as a numeracy problem rather than a vibes problem. We will work through how the handicap is constructed, which numbers actually matter (and which do not), why home-court advantage is now worth less than it used to be, how alternate spreads change the value equation, and where ATS records become useful information rather than confirmation bias dressed up as data.
To maximize your profits when betting against the spread, it is crucial to understand how to find positive expected value in decimal odds before placing your wagers.
How the spread works at UK bookies, in plain English
The point spread does one thing: it removes the question of who wins and replaces it with the question of by how much. A spread of -6.5 on the home team means the home team must win by seven or more points for a bet on them to cash. A spread of +6.5 on the away team means the away team must win the game, or lose by six or fewer, for a bet on them to cash. The half-point means there are no pushes — every bet wins or loses outright, no stake returned.
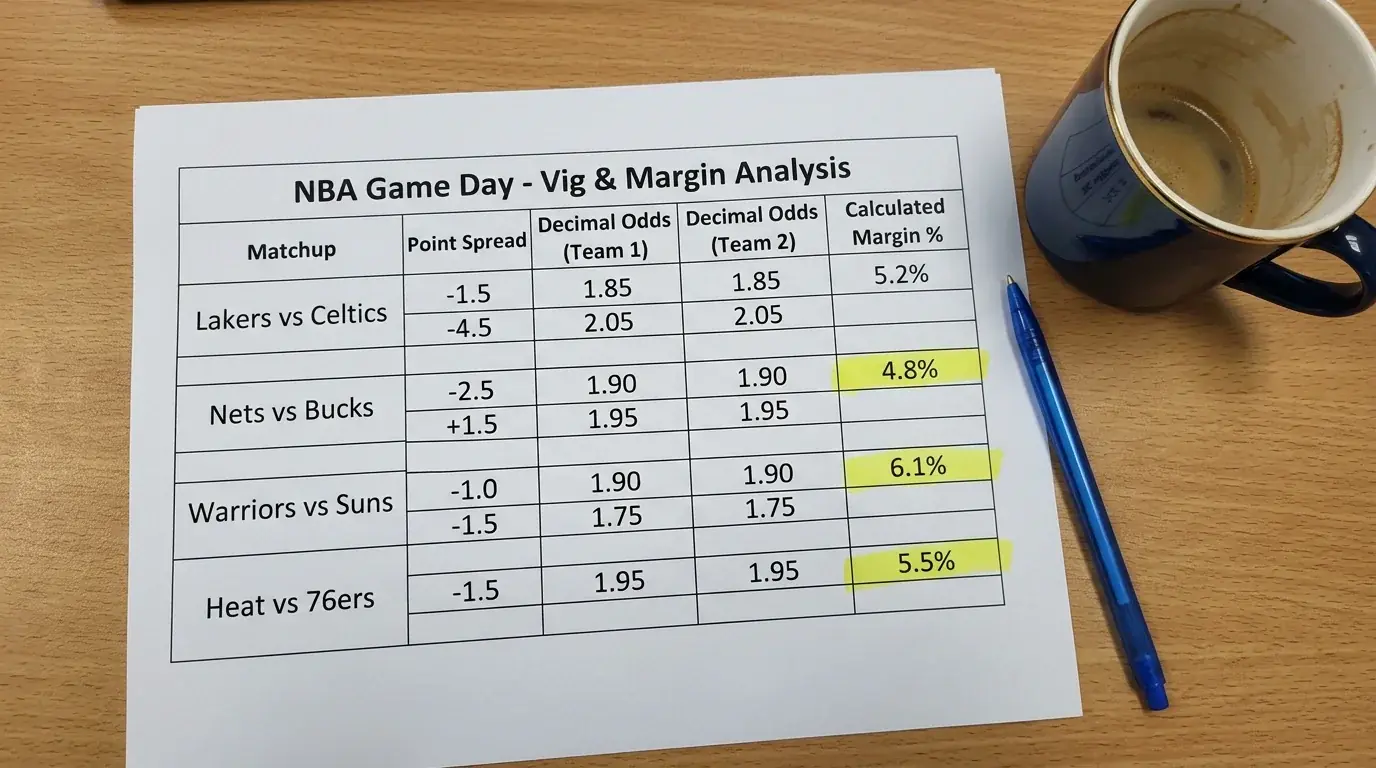
The price attached to the spread is typically close to evens — most UK books offer NBA spreads around 1.90 to 1.95 (or in fractional, 10/11 or 11/10). The 5-10% vig embedded in those prices is the bookmaker’s margin, and it is the structural headwind every spread punter is betting against. To break even at 1.91 you need to cover the spread 52.4% of the time. To make real money, you need to be doing it noticeably more often than that, across a sample big enough that the variance washes out — which, in NBA, takes hundreds of bets.
The mechanics of spread betting in the UK are slightly different from the rest of the world only in presentation. You will see the spread shown in fractional or decimal odds depending on the bookmaker, and some books still default to fractional even on US sports. The underlying maths is identical to anywhere else: a -6.5 line at 1.91 is exactly the same bet whether the book displays the price as 1.91, 10/11, or -110. Where UK books do differ is in the breadth of alternative markets attached to the spread — handicap-with-overtime-included, half-spread markets, race-to-N-points markets — and in the willingness to offer enhanced or boosted prices on spreads as promotional hooks. The headline spread is the same. The packaging is what changes.
One thing worth flagging early: the home team is not always the favourite. The home team gets the negative handicap on most nights, but when a strong road team visits a struggling home side, the visitor will be laying points and the home team will be the underdog. The spread is a function of team strength minus opponent strength plus a venue adjustment, not a function of where the game is played. Reading the board for “who is favoured” should always start with the sign of the number, not the location of the game.
The key numbers that actually matter on NBA spreads
Spread betting in football and basketball is famously preoccupied with “key numbers” — the totals around which games most frequently land. In the NFL, three and seven dominate. In the NBA, the picture is messier and more interesting.
NBA games are decided by margins that distribute much more smoothly than football margins. There is no single dominant key number the way three is in the NFL. But there are still numbers that show up disproportionately often as final margins, and getting your bet on the right side of them matters. The big ones, in rough order of frequency: 1, 2, 3, 4, 5, 7, and 10. Roughly 30% of NBA games are decided by single-digit margins in the 1-5 range, with another meaningful chunk landing on 7 or 10.
What this means in practice. If you can buy a spread from +5.5 to +6.5, you are gaining access to the +6 number, which is one of those modestly-elevated key numbers. The price you pay for that extra point of cushion needs to be weighed against the actual frequency of games landing on +6. If the book is charging you an extra 15-20% of vig for the half-point, the maths almost never works in your favour. If they are charging 5%, it sometimes does. The general principle: you only want to buy points across key numbers, not across non-key numbers.
The flip side is selling points — taking a worse spread for a better price. If you are getting -5.5 at 1.91 or -4.5 at 2.20, the -4.5 is rarely the better bet, because you are giving up the key number around 5 for a price improvement that does not compensate. The half-point you lose by moving the spread the wrong direction across key numbers is worth more than the price improvement in almost every case.
Three on top of this. The 2025-26 pace surge has pushed average team scoring to 117.7 points per team per game, the third-highest in NBA history. Higher totals do not mechanically widen winning margins, but they do widen the distribution. More possessions means more variance in final margins, which means key-number-based strategies that worked in slower eras are slightly less reliable now. The +5.5 buys-points trick is still real, but it is a slightly weaker tool than it was a decade ago.
Home-court advantage, recalibrated for the modern NBA
This is the section where I want you to pay closest attention, because the consensus in casual coverage is at least a decade behind the data. Home-court advantage in the NBA is not what it used to be. Adam Silver’s commissioner, Prime Video’s broadcast packages, none of that matters as much as the structural reality: the home team wins less often than they used to, and the spread has been moving to reflect that, but not as quickly as the underlying numbers have.
The historical numbers are stark. In the 1980s, home teams in the NBA won 66.2% of games. In the 2020s, that figure has collapsed to 55.1%. The 11-percentage-point swing is one of the largest changes in any major sport across the same period. The closing home spread, which used to sit comfortably above 3 points on a typical matchup, has compressed to an average of just 2.05-2.10 points across the last 2.5 seasons. The market has moved. It just has not moved all the way.
Why has HCA eroded? The cleanest explanation is the three-point revolution. The correlation between league-wide three-point attempts and home-team winning percentage across 43 seasons is r = -0.88, an extraordinarily strong negative relationship. The mechanical logic is straightforward: the three-point shot is a high-variance event, and when high-variance events drive a larger share of total scoring, the structural advantages a home team enjoys — referee subconscious bias, crowd influence on free-throw routines, familiarity with rim lighting and depth perception — get drowned out by the noise of a hot or cold shooting night. The home team’s edges in the half-court matter less when 40% of points come from beyond the arc.
What this means for the UK spread punter. The default mental model — “home team is worth three points” — is wrong by a full point on average, and wronger than that on specific matchups. Strong road teams in the modern NBA are systematically under-priced when the book lays them less than 2 points on the road, because the venue adjustment is smaller than the public still believes. The market knows. The sharp money is on the road. The recreational money is on the home team. The line sits where it sits because the book has balanced both sides, but the closing line on the road favourite is a sharp number more often than not.
One caveat. HCA varies dramatically by team and by venue. Denver at altitude is structurally different from Brooklyn at the bottom of the league standings on a Tuesday in February. The 2 points is a league average. Specific teams maintain stronger or weaker actual HCAs, and the books price those individually. You are not betting against the league average. You are betting against the bookmaker’s specific HCA estimate for tonight’s specific matchup, which is sharper than the league average. The full deep-dive on this dynamic lives in the dedicated piece on the three-point era and the eroding home edge.
Line movement and what sharp action actually looks like
The first time you watch an NBA spread move two points in five minutes, you assume something dramatic happened — an injury, a referee leak, a power outage at the arena. Usually, it did not. The spread moved because a large bet hit the market and the book adjusted to balance their book. That is line movement, and reading it is one of the trickier skills in spread betting.
Two kinds of movement matter: directional and informational. Directional movement is the line moving because of bet volume, regardless of who placed the bets. If 70% of the public money is on the home team, the home spread will tend to grow (the book lowers the price to attract underdog money). Directional moves are weak signals — they tell you about money distribution, not about whether the money distribution is correct.
Informational movement is the line moving against the public money. If 70% of the money is on the home team but the spread is shrinking — meaning the underdog is getting better numbers, despite less money on them — that is a sharp move. Someone with large stakes and a record of being right is betting the unpopular side, and the book is moving the line to attract more money to the popular side. The technical term is “reverse line movement”, and it is one of the better single signals available to a UK punter who has the data to track it.
The practical problem in the UK is that most books do not publish their bet distribution. You can see the spread movement, you cannot see the money distribution easily. Some odds-comparison sites infer it from price-movement patterns, but the inference is imperfect. You can still glean a lot from raw price movement, especially across multiple books: if every UK book moves the spread the same direction at the same time, the action driving it is probably distributed and reasonably sharp. If one book moves while others stay flat, the move is more likely a single large recreational ticket, not informational.
The timing of movement matters too. Lines that move within minutes of release are usually responding to sharp openers — books posted a soft number and the market corrected immediately. Lines that move in the hour before tip-off are usually responding to late information, most often injury news or rotation decisions. Lines that move overnight, from UK morning to UK afternoon, are often the most boring kind: rebalancing as recreational money trickles in from US bettors waking up to the slate.
Alternate spreads and buying points: when the maths actually works
Every UK book offering NBA spreads will also offer a menu of alternate handicaps — different point totals at different prices. The mainline might be Lakers -6 at 1.91. The alternate menu will offer Lakers -4.5 at 1.62, Lakers -5.5 at 1.78, Lakers -7.5 at 2.05, Lakers -9.5 at 2.62, and so on. The pricing is structured so that, in theory, the EV of every alternate is roughly equal to the EV of the mainline, with the book’s margin baked in evenly across the line.
In practice, the pricing is rarely that clean. Alternate spreads are priced from the same model as the mainline but with a wider vig structure, because the lower volume on alternates allows the book less ability to balance their book through volume. The vig on a Lakers -9.5 at 2.62 might be effectively 8-10%, against 4-5% on the mainline. That extra margin is the price of optionality, and you are paying it whether you realise it or not.
When does buying points across alternates actually pay? When you cross a key number at a reasonable price. Moving from -6 to -5.5 crosses one of the modestly elevated NBA key numbers around 5, and the price you pay for that move at most UK books is in the ballpark of 0.06-0.08 of decimal odds — manageable. Moving from -7.5 to -9.5 crosses no key numbers and pays you a much worse price for a unit of cushion that mathematically rarely matters. The first move is sometimes +EV. The second almost never is.
The other valid use for alternates is correlated betting structures — taking the alternate spread on a team where you also have a position on the total, for instance, or building parlay legs from alternate spreads at different books to exploit correlated outcomes. That is sophisticated work, and I am not going to pretend it is the average UK punter’s daily play. But the option exists, and the alternate spread menu is the gateway to it.
Reading ATS records: signal, noise, and the small-sample trap
“The Celtics are 23-7 ATS at home this season.” It is the kind of stat that gets dropped into every preview piece and treated as significant. Usually, it is not. Or rather, it is sometimes significant, but not for the reasons most people cite it.
An ATS record is a sample. A 30-game sample is small. The standard deviation of a fair coin flipped 30 times is around 2.7 — meaning a perfectly random 50/50 process will produce records of 18-12 or 12-18 with reasonable frequency. The Celtics’ 23-7 home ATS record might be a real signal of a covering pattern. It might also be variance plus selection bias dressed up as a trend. Without the underlying structural reason — why are they covering at home, mechanically? — the number is data without meaning.
What ATS records can usefully tell you. They are an honest record of what has happened, and certain patterns hold up across larger samples. Game 7 home teams in recent seasons have gone 5-2 SU and 5-2 ATS as favourites — a small sample, but consistent with the long-standing observation that home teams in win-or-go-home spots tend to be properly priced and slightly under-priced relative to the gravity of the game. Heavy road dogs against vastly inferior opponents tend to cover at decent rates because the spread is set assuming both teams will compete; when one team has already mailed in the season, the spread is wrong. Teams on the second night of back-to-backs with travel cover at meaningfully reduced rates against rested opponents — a tendency the books have priced in, but not always fully.
What ATS records cannot tell you. They cannot tell you a team is “due” to cover because they have missed five in a row. They cannot tell you that a coach “always covers in November”. They cannot, on their own, distinguish noise from signal in samples below 50 games. They are evidence, not conclusions. The punter who treats them as conclusions is the punter the book is happy to take action from.
The honest way to use ATS records is to start with a structural hypothesis — “I believe this team is mispriced because of X” — and then check whether the ATS record is consistent with the hypothesis. If you build the hypothesis after seeing the record, you are p-hacking, and the bet you place on the back of it will not perform as well as the historical sample suggested. The forward sample is always smaller than the backward sample, and the regression to the mean is brutal on a strategy built backwards.
For daily insights and expert predictions, always check our top UK NBA betting tips platform to stay ahead of the market.
Playoff spread dynamics: when the regular-season model breaks
The playoffs are a different sport from a betting standpoint. Rotations tighten, pace slows, three-point variance amplifies, and the books know all of this. Playoff spreads behave differently from regular-season spreads, and a strategy that pays in October will quietly stop paying in May if you do not adjust.
The biggest single change is rotation depth. Regular-season teams play 9-10 players meaningful minutes. Playoff teams play 7-8. The star load goes up, the depth-player minutes go down, and the variance distribution of game outcomes changes accordingly. Stars are more consistent than role players over individual games, so playoff games tend to land closer to their priced spreads than regular-season games do — fewer wild blowouts in either direction, more outcomes clustered around the bookmaker’s expected margin.
Home-court in the playoffs is a more interesting question than in the regular season. The seven Game 7s since May 2025 show home teams going 5-2 SU and 5-2 ATS as favourites. That is a small sample and not statistically conclusive, but it is consistent with the wider playoff pattern: home teams in elimination games are priced reasonably, and the historical edge is not as large as casual coverage implies. The market has tightened. The “home team always wins Game 7” narrative is doing less work than it used to.
Series prices and game-specific spreads diverge in the playoffs in ways recreational punters often miss. A team can be a clear favourite in a series price while being a series of close-spread games on a game-by-game basis. The series price expresses an aggregate probability over four to seven games. The game spread expresses tonight’s matchup. These are different bets with different EV characteristics, and conflating them is a mistake. A team you believe will win the series is not automatically a bet on tonight’s game.
What the spread teaches a UK punter, in the end
The point spread is the bookmaker’s distilled opinion about a basketball game, expressed as a number. The most useful thing a UK punter can do is treat that number with respect — assume the book has thought about it more than you have — and then look for the specific situations where your analysis genuinely disagrees with the book’s by enough to overcome the vig.
Those situations exist. The 2025-26 NBA is a faster, higher-variance league than it was even five years ago, with a home-court advantage that has eroded structurally and a market that has not fully caught up on every matchup. UK books are priced sharply on primetime games and slightly less sharply on weeknight nothing-burgers, and the line shopping advantage of multiple licensed operators gives you access to half-point edges across key numbers that, over a season, compound into a real edge.
The work is in the discipline. Track your closing line value. Build a structural hypothesis before you look at the ATS record. Buy points across key numbers, never across nothing. Respect that the home team is now worth two points, not three, and that the books mostly know it. And resist the urge to bet the eye test when the number tells you the eye test has already been priced in.
Why is home-court advantage worth less than the bookies’ standard 3-point handicap in modern NBA?
Home-court advantage in the NBA has declined from a 66.2% home winning percentage in the 1980s to 55.1% in the 2020s. The three-point revolution is the structural cause: the correlation between league-wide three-point attempts and home winning percentage across 43 seasons is r = -0.88. Higher-variance scoring drowns out the small structural advantages home teams used to enjoy. The closing home spread now averages 2.05-2.10 points, not 3, and the books have largely priced this in.
Which point-spread numbers matter most when betting NBA totals games?
The NBA does not have one dominant key number the way the NFL has three, but margins cluster around 1, 2, 3, 4, 5, 7, and 10 with meaningful frequency. Buying points across 5 (moving from -5.5 to -4.5, say) is occasionally worth the price you pay; buying points across non-key numbers like 8 or 12 almost never is. The half-point matters most when it crosses one of these elevated frequencies.
Are alternate NBA spreads ever good value?
Sometimes, when you cross a key number at a reasonable price relative to the vig. The standard mainline spread carries 4-5% vig at UK books, while alternate spreads typically carry 8-10% because the lower volume reduces the book’s ability to balance their book. Moving across a key number at modest extra vig can be +EV. Moving across nothing meaningful, paying extra for a wider cushion, almost never is.
Written by the editors at nba bet of the day.