Basketball Over Under NBA Totals Betting for UK Punters
 Available in US
- Over Under Lines: From Quirky Wagers to High-Value NBA Betting Markets
- How totals work at UK bookies, in one paragraph and one example
- Pace, properly defined and why it dominates everything
- Effective field goal percentage and the three-point rate
- First-quarter and half totals: where the soft prices hide
- Team totals and the markets UK bookies actually price well
- Rest, schedule, and how UK tip-off times factor in
- Playoff totals: a different sport from a betting standpoint
- What 230 actually means for a UK punter tonight

Over Under Lines: From Quirky Wagers to High-Value NBA Betting Markets
The first NBA total I ever bet was 198.5. I remember it because I thought it was high. I had been raised on football, where a 3.5 total is a coin-flip and a 4.5 total is “are we expecting a flood?” In basketball, you have to recalibrate the meaning of the numbers entirely. Then I checked my notebook last week against a fresh slate and saw totals consistently set at 232, 235, 238. The 198.5 of fifteen years ago is now a thirty-point underdog to where the average line sits today.
The reason is sitting in the data. The 2025-26 NBA season opens with the league averaging 101.9 possessions per 48 minutes — the highest pace recorded in 30 years of play-by-play data. Average team scoring is 117.7 points per game, the third-highest in NBA history and the highest in 64 seasons. Multiply two teams by that number and you have where the totals line should live. The bookmakers know it. They have moved the lines. The question for a UK punter is not whether totals are higher — that ship sailed about five years ago — but whether the lines have moved correctly for the specific game in front of them tonight.
This guide walks through what a totals bet actually is, why pace is the single most important input on the line, how three-point variance drives the over and under, where quarter and half totals create opportunities the full-game line misses, and how the playoff shift compresses scoring in ways that consistently catch out punters who only watched the regular season.
While predicting the total game score is popular, many punters find a more consistent edge by exploring NBA player props and individual matchup advantages.
How totals work at UK bookies, in one paragraph and one example
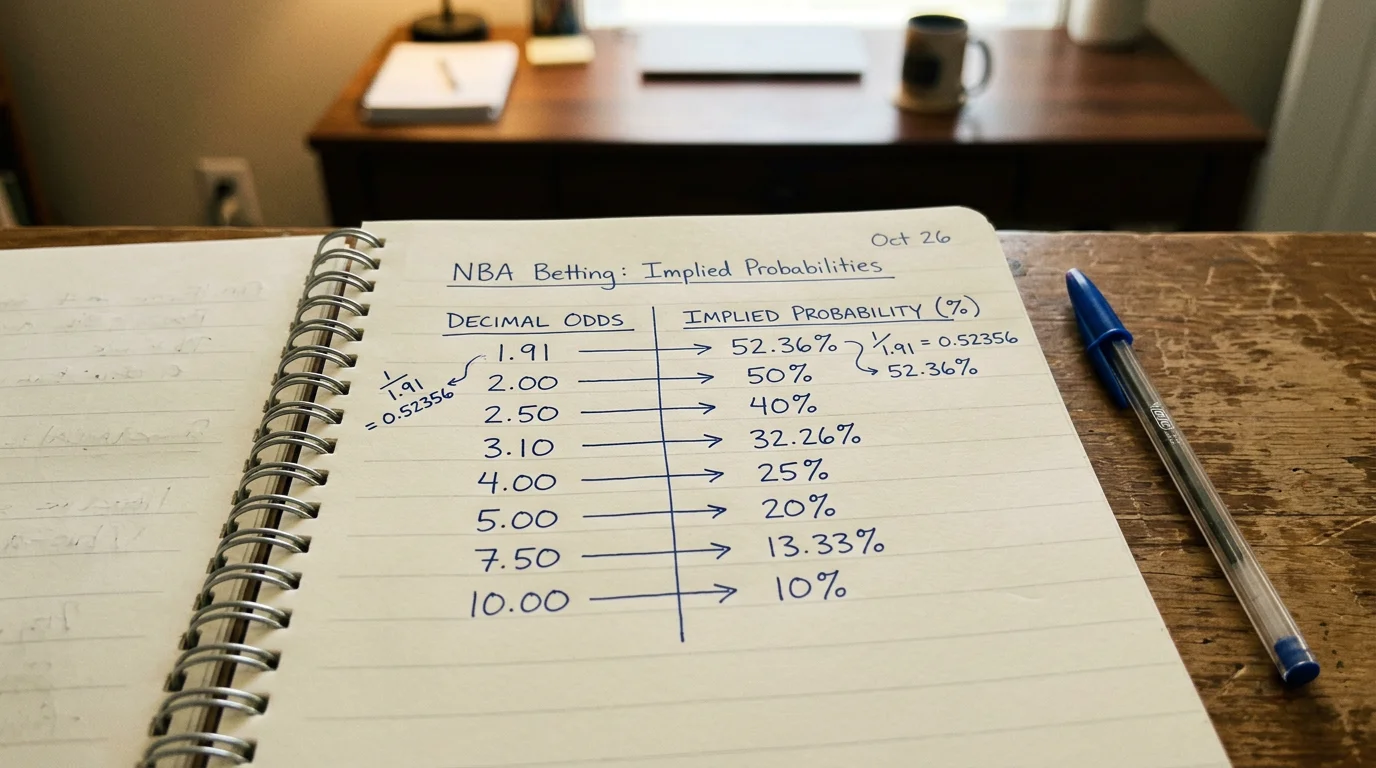
A totals bet is a wager on the combined final score of both teams against a number the bookmaker sets. Bet the over and you need the combined points to exceed the line. Bet the under and you need them to fall below. Half-point lines mean no pushes. Whole-number lines mean a push returns your stake. Most UK books offer totals at 1.90 to 1.95 on both sides, which works out to a 4-6% margin on the market — slightly higher than moneyline vig, slightly lower than typical prop vig.
Example. Suns at Nuggets, total set at 234.5. Combined final is 119-117 = 236. Over wins. Combined final is 117-115 = 232. Under wins. Combined final is exactly 234 with a 234.5 line? Under wins. Combined final is 234 on a 234.0 line? Push, stakes returned. The simplicity is the appeal. There is no spread to track, no late-game intentional fouling to navigate. You are betting on rhythm.
The vig differs between full-game totals and partial-game totals (quarter or half totals). Full-game lines tend to be the sharpest. Quarter totals, particularly first-quarter totals, carry wider margins because the lower volume gives the book less ability to balance their book through volume alone. We will get to why the higher vig is sometimes worth paying when we hit quarter totals later. The mainline full-game total is where most UK money flows and where the pricing is therefore tightest.
Pace, properly defined and why it dominates everything
Pace, in basketball analytics, is the number of possessions a team uses per 48 minutes. It is not the same as scoring. A team can be high-pace and low-scoring (lots of possessions, lots of misses) or low-pace and high-scoring (fewer possessions, more efficient finishing). Pace just tells you how many opportunities each team will get in the game. Scoring tells you what they do with those opportunities.
Why pace dominates the totals line: the total is roughly pace x points-per-possession x 2 (both teams). Every additional possession is, on average, a bit over one point added to the expected combined score. A game between two teams averaging 100 possessions per 48 will produce a meaningfully different scoring environment from a game between two teams averaging 105 possessions, even if their efficiency numbers are identical. Pace is the volume dial. Efficiency is the per-unit dial. You need both, but pace is what the line moves on first.
The 2025-26 league-wide pace of 101.9 possessions per 48 is the highest in 30 years. That is genuinely a structural shift, not a temporary blip. The mechanisms are well-documented: shot clock changes earlier in the decade, a generation of coaches who came up in pace-and-space systems, the strategic value of “first good look” over “best look”, and the simple maths that more possessions means more three-point attempts which means more variance which means more chances for the team behind to come back. Pace is a feature, not a bug, of the modern game.
The trap for the UK punter is reading pace as a one-way street. A high-pace matchup does not automatically produce an over. It produces a wider distribution of possible final scores. If both teams are also shooting cold from three on the night, a high-pace game can still go well under the line — more attempts, more misses, same outcome. Pace is necessary but not sufficient. You also need efficiency.
The cleanest practical use of pace: identify games where the two teams’ typical paces match (both fast, or both slow) versus games where one team consistently slows opponents down. The clash matters. Two fast teams compound — each will play at the higher of the two paces because neither resists the other’s tempo. A fast team meeting a slow team will typically play closer to the slow team’s pace, because the slow team controls more of the half-court possessions. The market knows this. The market still sometimes prices it as if both teams’ paces simply average, which is when you find your edge.
Effective field goal percentage and the three-point rate
Pace tells you how many possessions. Effective field goal percentage tells you how productive those possessions are. Combined, they give you the shape of expected scoring better than either does alone.
eFG% adjusts standard field-goal percentage to account for the fact that a made three-pointer is worth more than a made two-pointer. The formula is (FG made + 0.5 x 3PT made) / FG attempted. League average eFG% in the 2025-26 season is running close to the all-time high, driven by the continued shift toward three-point shooting and the gradual improvement in shot selection across the league.
Why this matters for totals: the three-point shot has higher variance than the two-point shot, so the same team can produce dramatically different scoring outputs on different nights depending on whether their threes are falling. A team shooting 38% from deep on a good night will score 12-15 more points than the same team shooting 32% on a bad night, holding everything else constant. The total line is set against an expected eFG%, and the actual eFG% on any given night will fluctuate around it.
The correlation between league-wide three-point attempts and home winning percentage across 43 seasons is r = -0.88. That figure matters here too, indirectly — the same three-point variance that has eroded home-court advantage is what makes single-game totals less predictable than they used to be. A higher three-point rate means a wider distribution of possible final scores around the line. The bookmaker has to price wider vig to protect against that variance, and the under-bettor who used to feast on slow-pace, two-point-dominated games has fewer such matchups available to bet.
The honest practical advice: do not over-weight a single recent shooting performance. A team shooting 12-of-22 from three last game is not a 12-of-22 from three team going forward — they are most likely a 35-38% shooter who had a hot night. The reversion to mean is brutal on totals bets built around small-sample hot streaks.
First-quarter and half totals: where the soft prices hide
I have a soft spot for first-quarter totals because they reward exactly the kind of work most casual punters refuse to do. The full-game line gets all the volume and is priced sharp. The first-quarter line gets a fraction of the volume and is priced wider, with looser margins protecting the book against the smaller sample. That gap is where edges live.
A first-quarter total is just the over/under on combined points scored in the opening twelve minutes. The line is usually set at roughly 27-30% of the full-game total — a quirk of NBA scoring distributions, where first quarters tend to come in slightly below the proportional share you would expect (29-31%). Books that anchor the first-quarter line to a fixed ratio of the full-game line are leaving room for punters who understand which matchups are likely to deviate from that ratio.
The most exploitable deviations: teams with strong starting fives but weak benches will out-perform their full-game totals share in the first quarter (the starters are on, the variance is lower, the per-possession efficiency is higher). Teams that habitually warm up slowly — common with veteran-heavy rosters — will under-perform first-quarter share. The market mostly knows this. The market does not always price it sharply on a Tuesday night nothing-game in February.
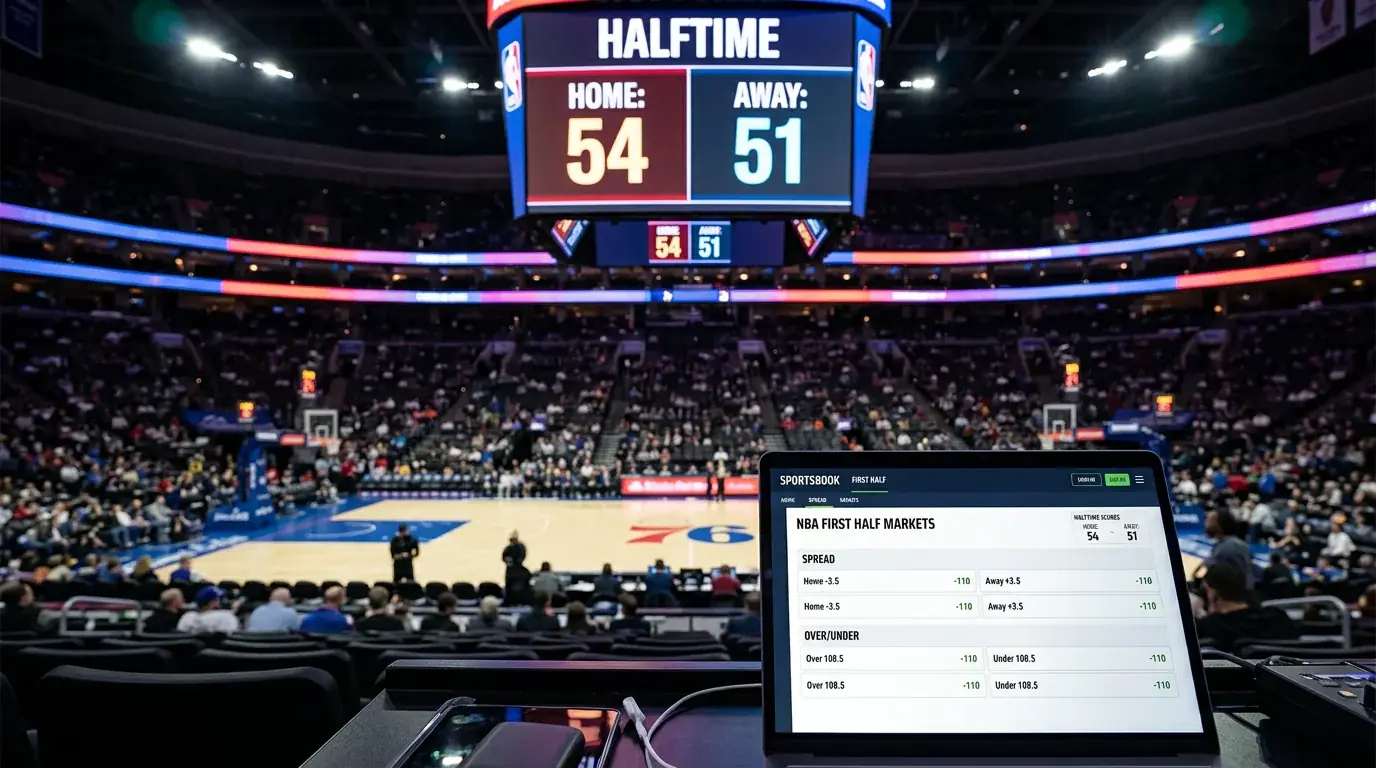
Half totals are slightly different. The first-half line splits the game in half, and the variance over 24 minutes is much closer to the variance over 48 minutes than the 12-minute first quarter is. The vig on half totals is correspondingly tighter, and the edge is harder to find. But half totals have one structural advantage: they end at half-time, before the second-half coaching adjustments that can dramatically change game flow. If you have a strong read on how two teams will play their starting lineups against each other, the first-half total isolates that read without the noise of bench rotations and matchup changes.
The vig you pay for these partial-game markets is the cost of admission. The UK books are not running them as charity. But the wider margin is the entry price to a market where less sharp money is flowing and your analysis can compete more cleanly with the bookmaker’s model.
Team totals and the markets UK bookies actually price well
Team totals are individual-team over/under markets — the over/under on just the Lakers’ final score, or just the Celtics’ final score, regardless of the opponent. They are surprisingly under-bet by UK recreational punters, who mostly cluster around the full-game total. That under-use is itself a small structural advantage for those willing to learn the market.
Team totals are usually set at roughly half the full-game total, adjusted for the spread. If the spread is Lakers -6 with a total of 232, the implied team totals are Lakers 119 and opponent 113. UK books offer team totals around those numbers, sometimes a half-point off, sometimes a point off. The vig is typically wider than the full-game total — closer to 6-8% — because the smaller volume requires the book to price defensively.
Why team totals are interesting: they decouple the over/under question from the matchup question. If you think the Lakers will score a lot regardless of how the Celtics play tonight — because their pace is up, their starters are healthy, their rotation is full — you can bet that specifically without taking a position on what the Celtics will do. The bet expresses a narrower opinion, and narrower opinions are sometimes easier to be confident about than full-game predictions.
The classic team-totals edge: home favourites in lopsided matchups against teams with poor defensive ratings. The total can be set conservatively (the bookmakers know the road team will probably check out at some point), but the home favourite’s team total can be set generously, and a home team running away from a beaten opponent reliably puts up large individual scoring nights. The bet is the home team’s over, not the full-game over. Different bet, different EV.
Stay updated with the most accurate lines and pace analysis by visiting NBA Bet of the Day every morning.
Rest, schedule, and how UK tip-off times factor in
The second night of a back-to-back is the most consistent edge in NBA betting that has not been completely priced out. Teams on zero days of rest, especially with travel between games, consistently underperform their priced expectations in both points scored and pace. The mechanism is unsexy: tired legs translate into worse shooting and slower transition offence. The market has priced in part of this effect, but not all of it, because the bookmakers also have to weigh public-money distribution and the public mostly bets the favourite.
The contrast spot is the rested team off four-plus days of rest. Coaches do strange things with their starting rotations after long breaks — minutes restrictions, experimental lineups, intentionally slower paces to get the rust out. Teams just back from rest are often soft in the first quarter even if they finish the game strong. First-quarter totals on rested teams tend to come in below their season averages, and the under is occasionally a sharper bet than the headline number suggests.
For UK punters specifically, the schedule reads through the prism of UK tip-off times. The bulk of NBA games tip off between 11pm and 4am UK time, which means the relevant question is not “is this a back-to-back?” but “when does the relevant injury news drop, and how does the UK overnight window affect my access to it?” The 11-year media-rights deal worth $76 billion across Disney, NBC, and Amazon Prime Video that began with the 2025-26 season has expanded UK access to live games dramatically, but the late tip-offs have not gone anywhere. As Alex Green of Prime Video Sport International put it after the audience numbers landed: “Audiences are consistently tuning in and making the NBA on Prime a part of their weekly sports schedule.” Pre-game bet placement happens in UK evening hours. The morning-after settle is when the bet has already played out.
Practically, this means UK punters need to make peace with placing bets earlier than US punters do, with less of the late information advantage that comes from being awake during US East Coast prime time. The schedule-and-rest edges are still there. The window for acting on them is just compressed.
Playoff totals: a different sport from a betting standpoint
If regular-season NBA betting is the sport of pace, playoff NBA betting is the sport of half-court execution. Everything compresses. Rotations tighten, possessions slow, fouls become strategic weapons, and the totals line drops accordingly. A team averaging 117.7 points in the regular season — the third-highest team scoring average in NBA history this season — will routinely play playoff games in the 105-110 range.
Why? Several mechanisms compound. Possession length increases because defences sit down on specific sets the opponent runs, forcing late-clock shots and possessions that play out closer to 22 seconds than 16. Three-point attempt rates often dip, with teams generating better looks from inside but fewer attempts overall as the games become more deliberate. Star players play more minutes, which improves per-possession efficiency but reduces total possessions because better players run more sets to completion. Bench scoring collapses because benches shorten.
The UK punter’s mistake is reading playoff totals against the regular-season scoring environment. The line might look low. It usually is not. Books have been pricing playoff totals against the actual playoff scoring distributions for years, and the unders that look attractive based on the 117.7 PPG regular-season number are usually traps. The professional read in the playoffs is to assume scoring will come in lower than the regular-season market would suggest, and to look for spots where the line has not adjusted enough rather than spots where the line looks low.
The other playoff dynamic worth flagging: Game 7s. The pace tends to slow further, the fouling becomes more cautious (no team wants their best player on the bench), and totals routinely come in well below the priced number. Game 7 unders have been a long-running soft edge in NBA betting. The books have tightened over the last few years, but the structural reason is still there: every possession matters, and teams play accordingly.
What 230 actually means for a UK punter tonight
The headline total is now firmly above 230 on a typical NBA night. That is the new normal, not a quirk. The 2025-26 pace of 101.9 possessions per 48 and average team scoring of 117.7 puts the league firmly in a high-scoring era, and the totals lines have moved with it. The work, for the punter, is not deciding whether totals are higher than they used to be — they are — but identifying the specific games where the line has lagged the underlying scoring environment, or moved too far, or failed to price in a specific factor like rest or pace mismatch.
The edges live in the partial-game markets and the team totals more often than in the headline number. The full-game total is the sharpest market the book offers on most NBA games, and trying to consistently beat it without an analytical advantage is a slow drain on bankroll. The first-quarter line, the team totals, the rest-driven mismatches — these are where the UK punter willing to specialise can compete.
The deeper structural reading: NBA totals betting is a probabilistic exercise, not a directional one. You are not predicting the final score. You are estimating a probability distribution of possible final scores and identifying mispricings in that distribution. The over/under is just a particular slice of that distribution. The punter who internalises this stops looking for “the over” or “the under” as a default and starts asking, on every game, where the bookmaker’s expected total sits relative to their own estimate, and whether the gap is wide enough to overcome the vig. The full deep-dive on the pace inputs themselves lives in the dedicated primer on NBA pace, and the deeper analytical work always returns to it.
How does pace actually translate into the over/under line for an NBA game?
Pace is the volume dial on scoring. The total is roughly pace x points-per-possession x 2 (both teams), so a five-possession swing in pace translates to about six combined points on the line. The 2025-26 league average of 101.9 possessions per 48 is the highest in 30 years, and totals lines have moved to reflect it. The edge is in identifying specific games where the two teams’ typical paces clash — fast vs. slow tends to land closer to the slow team’s tempo because the slow team controls more half-court possessions.
Are first-quarter totals softer than full-game totals at UK bookmakers?
Generally yes. First-quarter totals carry wider vig because lower volume gives the book less ability to balance through stakes alone, and the smaller 12-minute sample is harder to price precisely. The most exploitable deviations come from teams with strong starting fives but weak benches, who over-perform their full-game share in the first quarter, and veteran-heavy rosters that habitually warm up slowly and under-perform it.
Why do NBA playoff totals usually land lower than regular-season ones?
Playoff basketball compresses possessions. Defences sit down on specific sets, forcing late-clock shots, and bench rotations shorten so fewer below-average minutes are played. Star players take more possessions to completion but at a slower pace. The result is regular-season teams averaging 117.7 PPG often playing playoff games in the 105-110 range, and the betting trap is reading playoff lines against the regular-season scoring environment rather than the actual playoff distribution.
Prepared by the nba bet of the day editorial staff.