Profitable NBA Player Props Betting for UK Punters
 Available in US
- Player Prop Restrictions: Market Shifts and UK Line Opportunities
- How props work at UK bookmakers, beyond the obvious
- Points props: where most volume lives and where most mistakes happen
- Rebounds and assists: smaller markets, often softer prices
- Combo props: PRA and the cleaner alternative
- Minutes projection is the foundation of every prop bet
- Matchup analysis and defensive ratings: where the work pays off
- Prop restrictions after Rozier–Billups: what changed
- Where the prop punter actually finds an edge in 2026

Player Prop Restrictions: Market Shifts and UK Line Opportunities
If you placed an NBA player prop with a UK book at any point before October 2025, you were betting in a different market from the one you are betting in today. The Terry Rozier–Chauncey Billups federal indictment that landed in late October — more than 30 figures charged in connection with illegal sports betting and fraud schemes involving an active NBA player and a head coach — did not just make the front page of every sports section. It mechanically changed the prop market. UK bookmakers, taking their cue from US partners and the league’s own statements, pulled categories of two-way player props within days. The market that survived is tighter, sharper, and structurally different from what it was six months ago.
That is the context I want you to hold throughout this guide. Player props are not just another market — they are the market that has shifted the most in the past year, both in availability and in pricing logic. For the UK punter trying to find value, that is both a problem and an opportunity. The problem is that some of the softest historical props have been pulled or repriced. The opportunity is that the recreational money is still betting props the way it bet them in 2024, while the underlying market has moved.
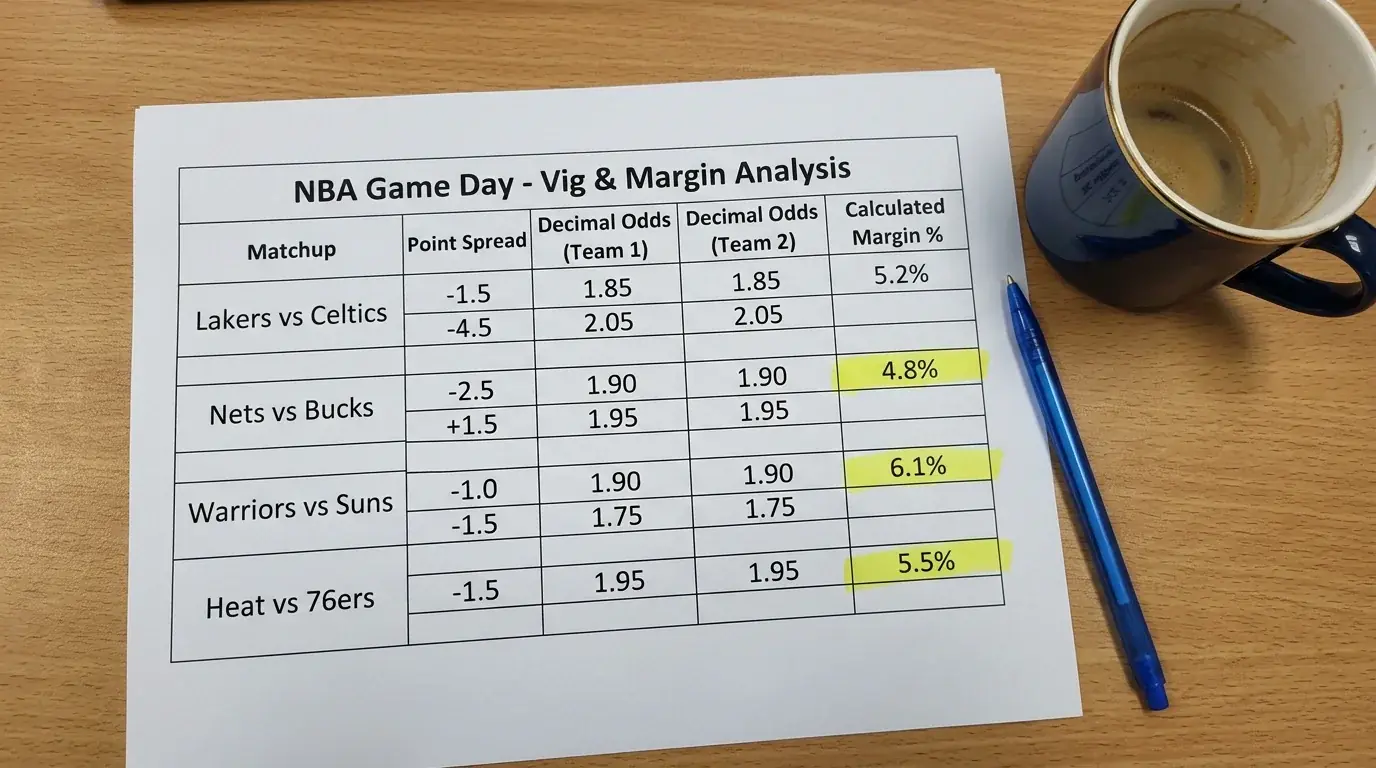
Here is the working framework. Player props are bets on individual player statistics — points scored, rebounds grabbed, assists dished, threes made, and combinations of these. Each has a line set by the bookmaker and a price on both the over and the under. Your job is to estimate the player’s likely production for the game, compare it to the line, and bet when the gap is wide enough to overcome the vig. The vig on player props is meaningfully wider than on mainlines — sometimes 8% or more on a single market — which means the projection work has to be sharper than mainline analysis to compete.
How props work at UK bookmakers, beyond the obvious
The mechanical setup is identical to any over/under market. The book sets a line (Player X to score over/under 22.5 points), prices both sides (typically around 1.85 on each, sometimes 1.90/1.80 when the book is leaning one direction), and settles based on the player’s final statistical line at the buzzer. Half-point lines mean no pushes. Whole-number lines can push and return the stake.
Where props differ from mainlines is in the volume and information environment. A primetime NBA game might attract twenty separate prop markets per starting player, plus combo props and milestones — easily 80-100 markets on a single game across the slate of UK books. Each of those markets has lower volume than the moneyline, which means each is priced with wider margins and less balancing-through-volume. The book is leaning more heavily on their model and less on the market correcting itself.
The data infrastructure behind these prices is worth understanding. Most UK books source their props from syndicated feeds — a small number of data providers sell statistical projections and pricing models to operators across the industry. The NBA’s deal with Sportradar monetises the sale of live stats to bookmakers and is one of the structural reasons prop markets have proliferated. As Isaac Rose-Berman, a fellow at the American Institute for Boys and Men, put it in a Fortune piece on the same trend: “When you’re able to bet what the next pitch in a baseball game is going to be, that’s because Major League Baseball is selling data to platforms for a pretty high price.” The NBA equivalent is the league monetising prop-grade statistical data, and the result is that most UK books are pricing from similar underlying models. The lines look correlated because they are correlated.
The implication for the UK punter: line shopping props across books finds smaller pricing gaps than line shopping mainlines, because the input data is more centralised. But those gaps exist, and they tend to live at the smaller and mid-sized operators who occasionally price off the syndicated model in ways the larger books do not. Worth checking, even if the variance is narrower than you would find on a moneyline.
Points props: where most volume lives and where most mistakes happen
The points prop is the canonical NBA player prop and accounts for the largest single share of prop volume at UK books. The line is set against an expected scoring projection that depends on three primary inputs: projected minutes, usage rate, and per-minute scoring efficiency adjusted for matchup.
Start with minutes. A player projected for 36 minutes will have a different scoring distribution from the same player projected for 28 minutes, even at identical usage and efficiency. Minutes are the foundation, and they are the input that most often gets mispriced when something changes — a teammate’s injury, a back-to-back, a blowout in the previous game that resulted in shortened minutes. The book has to update minutes projections faster than they update efficiency projections, and the lag is where edges live.
Usage rate is the percentage of team possessions a player uses while on the floor — by taking a shot, drawing a foul, or turning the ball over. Higher usage means more scoring opportunities per minute. A 30%-usage player at 35 minutes will score meaningfully more than a 22%-usage player at the same minutes. When usage shifts due to teammate availability — a primary scorer sits, a secondary scorer becomes primary — the prop line should move accordingly. It does, but not always proportionally to the actual usage swing.
Efficiency adjusted for matchup is the third dial. A player facing a team with weak perimeter defence will score above their season average. A player facing an elite defence will score below. The matchup adjustment is most visible on three-point-heavy scorers, whose scoring is volatile enough that the matchup can swing the projection 4-6 points either way. Defensive ratings, both team-wide and against specific positions, matter here. Most UK books are pricing matchup adjustments adequately on superstar matchups, less adequately on role-player matchups where the smaller sample obscures the signal.
The honest practical method: build a projection that says “this player will score X with a standard deviation of Y”, compare X to the line, and bet when X plus margin-for-vig favours one side. The standard deviation on a typical NBA points prop is significant — for a player projected at 22 points, a one-standard-deviation move is often 6-8 points either way. That is why even strong projections lose individual bets at high rates. The edges are measured in averages over hundreds of bets, not in single-game certainty.
Rebounds and assists: smaller markets, often softer prices
Rebounds and assists props attract less recreational volume than points props, which means slightly wider vig — and slightly looser pricing — at most UK books. The basic mechanics are identical (line, over/under, decimal prices), but the projection logic differs in important ways.
Rebound projections are driven heavily by pace and opportunity. More possessions means more shots means more rebounds, and a player on a fast-pace team in a matchup against another fast-pace team will see a meaningfully higher rebound projection than the same player against a slow-paced opponent. The 2025-26 pace surge of 101.9 possessions per 48 has nudged rebound averages slightly upward across the league. Books have priced this in at the season-aggregate level. They have not always priced it for specific high-pace matchups, especially earlier in the season before the pace expectations have stabilised.
The other rebound dynamic worth flagging: rebound props on guards and wings are much more volatile than on bigs. A starting centre projected for 11 rebounds will hit between 7 and 14 in about 70% of games. A starting guard projected for 5 rebounds will hit between 2 and 8 in the same 70% range — proportionally wider. The narrower lines on guards mean each rebound matters more relative to the line, and the variance can crush a projection-based bet quickly. The cleaner rebound props are on the bigs.
Assist projections are driven by usage and team scheme more than pace. A point guard who runs the offence sees consistent assist numbers regardless of pace. A wing playing alongside a primary playmaker has assist numbers that depend heavily on which lineups they share the floor with. Lineup-specific assist projections are where the syndicated models tend to be weakest, and where a UK punter with deep team-specific knowledge can occasionally find edges.
The combined-stat trap on these markets is the “double-double” prop — over/under whether a player will record double-digit numbers in two categories. The line price often looks attractive (1.80 on a 60-something-percent likelihood player). The underlying probability is harder to estimate than the line suggests, because the two categories are correlated (a player who plays heavy minutes is more likely to hit both thresholds), and the vig on the market is meaningfully higher than on the individual stat props. Treat these markets with caution.
Combo props: PRA and the cleaner alternative
Points-rebounds-assists (PRA) combined is increasingly the cleanest single-line prop available at UK books. The bet is on a single number — the player’s combined total of points, rebounds, and assists — against an over/under line. The book offers it as one market rather than three, with a single price on each side.
The appeal is statistical. Combining three correlated stat categories into one line reduces the variance of the bet relative to a single-stat prop. The standard deviation on a PRA projection for a player averaging 30 PRA is narrower (in proportional terms) than the standard deviation on the same player’s 18-point projection. More inputs, more averaging, less volatility on any one night.
The vig structure on PRA tends to be wider than on a single-stat line at most UK books, because the market is newer and the syndicated models have more uncertainty in the combined projection. The wider vig is the cost of admission to the lower variance. For a punter with a strong overall read on a player’s role but less certainty on category mix, PRA is often the bet that expresses the conviction with the least game-to-game variance.
One trap on combo props. The “double-double” and “triple-double” milestone props are not the same as PRA bets — they pay on category thresholds rather than combined totals. A player can score 30 points and grab 9 rebounds and miss a double-double while still beating a 30 PRA line. Know which structure you are betting before you place it.
Minutes projection is the foundation of every prop bet
I want to put this section in its own H2 because it is the single most under-rated input in UK prop betting. The line on a player’s points, rebounds, assists, threes, anything — moves first and most on changes to projected minutes. A teammate downgraded to out adds 4-6 minutes to the starter’s projection. A blowout the previous game might subtract 3-4 minutes from a starter’s projection if the coach pulled them early. A back-to-back with travel can compress everyone’s projected minutes by 2-3 across the board.
The reason minutes dominate: the per-minute production rate of a starting NBA player is reasonably stable from game to game. Their points-per-minute, rebounds-per-minute, and assists-per-minute fluctuate within tighter bands than their per-game totals. So if you know the minutes accurately, you can project the rest with much higher confidence than the headline season averages would suggest.
The minutes projection that books use comes from injury reports, coach press conferences, and historical rotation patterns. The injury report is the most actionable input. UK books update prop lines aggressively when statuses change, but there is always a window between the news breaking and the line moving, and that window is where the prop-line edges live for punters paying attention. For UK punters dealing with overnight tip-offs, the relevant injury news often drops between 7pm and midnight UK time — which is workable, even if it requires staying awake later than most evening leisure schedules accommodate.
The contrast spot is what I call “minutes regression”. A starter who played 41 minutes in their last game, well above their season average of 33, will almost certainly play closer to 33 in their next game — coaches do not chain 41-minute games together except in playoffs. The points-prop line might be set with implicit reference to the 41-minute outing if the book’s model is over-fitting to recent performance. The under on that prop becomes attractive even before you adjust for matchup or other factors. Minutes regression is unglamorous but consistently profitable for punters who track it.
Matchup analysis and defensive ratings: where the work pays off
The defensive matchup is the second-most-important input after minutes, and the one where the syndicated models do the most variable work. Team-wide defensive rating is broadly priced in. Position-specific defensive ratings — how a team defends opposing point guards vs. centres vs. wings — are priced in less reliably, especially against opponents the model has limited recent data on.
The cleanest matchup edges live on perimeter scoring against teams with strong three-point defence. A team forcing the lowest opponent three-point attempt rate in the league will systematically reduce the points production of catch-and-shoot wings, but the prop line on that wing might be set primarily off season-average scoring with only modest matchup adjustment. The under is the bet, and the edge is in the gap between “what the book adjusted by” and “what the matchup actually does to the projection”.
The trap, predictably, is over-weighting matchup data based on too-small samples. A team’s defensive rating against opposing power forwards across 12 games is informative but noisy. The same rating across 60 games is much more reliable. Read matchup data with the same epistemic discipline you would read ATS records — structural reason first, sample second.
The other matchup factor worth flagging is foul trouble exposure. A player who routinely racks up 4+ fouls — by virtue of role, defensive matchup, or referee tendencies — has compressed expected minutes regardless of what the rotation board says. The points and rebounds projections need a downward adjustment that the syndicated models do not always apply cleanly. Foul-trouble adjustments are work that the punter has to do themselves, and they consistently pay off on the right roles.
Prop restrictions after Rozier–Billups: what changed
This is the section where the modern market diverges most sharply from the historical one. In October 2025, the federal indictment naming Miami’s Terry Rozier and Portland coach Chauncey Billups (alongside more than 30 other figures) put the integrity of prop markets at the centre of the conversation in a way that previous cases had not. Commissioner Adam Silver responded directly: “There’s nothing more important to the league and its fans than the integrity of the competition, so I had a pit in my stomach. It was very upsetting.”
The mechanical response from the league, and from books across the industry, was to pull or restrict prop categories deemed most vulnerable to manipulation. Silver was specific about the targets: “We’ve asked some of our partners to pull back some of the prop bets. Especially when they’re on two-way players — guys who don’t have the same stake in the competition — where it’s too easy to manipulate something that seems small and inconsequential.” That is the operative principle. Props on two-way players (those splitting time between the NBA and the G-League) and props on micro-events that a single player can manipulate (first basket of the game, single-quarter performance lines on low-volume players) became less available across UK books within weeks of the indictment.
The longer-term consequence for the UK punter is structural. The prop markets that remained are concentrated on starters and high-minutes rotation players whose statistical lines are produced through normal-volume basketball. The looser, softer props that used to exist on the margins of the market are largely gone. The remaining market is sharper than it was twelve months ago, with tighter vig on the markets that survived and more careful monitoring of bet patterns by the books themselves.
Silver was also clear about the detection environment: “There are very sophisticated algorithms that track it. When they see aberrational betting, you’re going to get caught.” The implication for the legitimate punter is not that they are being watched as a suspect — they are not — but that the integrity infrastructure has tightened around the markets in ways that have flow-on effects for pricing and availability. The Rozier case carried unusual weight partly because his $26.6 million annual salary represents about 17% of the Miami Heat’s salary cap, making the question “why would a well-paid player participate in fixing?” central to the league’s response. The deeper case-study lives in the dedicated piece on what changed for the prop market after the indictments.
For UK punters, the practical takeaway is that the prop market in 2026 is a smaller, tighter, and more sharply-priced space than it was in 2024. The good news is that the integrity overhead has improved. The bad news is that the soft money on the margins of the old market has gone. The remaining edges live in projection work, not in pricing inefficiencies the books used to leave open.
Where the prop punter actually finds an edge in 2026
Stack everything from the sections above and the framework comes out something like this. Build a minutes projection first, then layer usage and per-minute efficiency on top, then adjust for matchup and rest. Compare the resulting projection to the offered line, accounting for vig (which on props is wider than on mainlines, often 6-10% per side). Bet when the projection-to-line gap meaningfully exceeds the vig. Track CLV by market to identify which prop categories you are sharpest on, and concentrate volume there.
The 2025-26 NBA is friendly to this framework on the points side, where higher pace and higher scoring increase the headroom for both over and under bets, but increase variance accordingly. The rebounds and assists side is steadier, with smaller pricing edges but lower variance. The combo and milestone markets are wider in vig and should be approached with caution — usually after you have established a clean read on the underlying single-stat projections.
The market has changed. The framework has not. The work is the same as it ever was: project the player, compare to the line, fire when the maths agrees. The Rozier case did not break NBA prop betting. It tightened it. The punters who profit from it from here are the ones doing the projection work, not the ones chasing the lines themselves.
How are NBA player props settled when a player gets injured mid-game at a UK bookmaker?
Settlement rules vary by bookmaker but most UK books fall into two camps. Some void the prop and return the stake if the player does not play the minimum required minutes (often 1 minute, sometimes higher thresholds for combo props). Others settle the prop at the player’s actual production at the time of exit, win or lose based on whether they had already cleared the line. Check the specific terms before placing — the difference between ‘void’ and ‘settle at exit’ is large on a prop where the player goes down at half-time.
Which usage and minutes thresholds make a points prop worth backing?
There is no universal threshold, but the cleanest projections happen at 30+ minutes of expected playing time and 22%+ usage rate, where per-minute scoring stabilises and matchup effects predict reliably. Below 25 minutes the variance widens significantly because rotation decisions and foul trouble matter more, and below 18% usage the projection depends heavily on the specific lineups the player shares the floor with. The strongest historical edges sit in the 30-36 minute, 25-30% usage band.
Why have UK bookmakers pulled some two-way-player props since late 2025?
The Rozier–Billups federal indictment in October 2025 put two-way player props at the centre of the integrity conversation, because two-way players have weaker incentives to maximise statistical performance and their props are lower-volume markets that single bets can move. UK books followed US partners in restricting these markets within weeks. The remaining props are concentrated on starters and high-volume rotation players where manipulation risk is lower and the statistical lines are produced through normal basketball.
Published by the nba bet of the day team.