Custom NBA Player Prop Model Building for UK Punters
 Available in US
- Projection Modeling: Engineering Custom Excel Sheets to Beat Prop Lines
- What a prop model actually needs to do
- The pace problem and why it matters more now
- Defensive matchup is half the model
- Where the soft lines actually are
- The role of context the model cannot see
- Validation and the part nobody wants to do
- What a small, sharp UK-based operation looks like
Projection Modeling: Engineering Custom Excel Sheets to Beat Prop Lines
Years ago I built a points-projection spreadsheet in a free afternoon, expecting it to be a side hobby. It is now the single most valuable file on my hard drive, and the iterations of it have outperformed every paid service I ever subscribed to. I am going to tell you how to build your own, why it matters more in the UK than in the US, and where the temptation to overcomplicate it will kill your edge.
NBA player prop markets are the softest mainstream betting markets in British sportsbooks. They are also the markets where books carry the highest margins, which sounds contradictory but is not – the books charge more because they know their pricing is rougher than the moneyline. That gap is the opportunity. The only way to systematically exploit it is to have a number of your own to compare against theirs.
What a prop model actually needs to do
Forget the marketing language around predictive analytics. A prop model needs to do exactly one thing: produce a projection for a player’s stat line that is more accurate than the implied projection embedded in the bookmaker’s line. If your projection beats theirs over a large enough sample, you make money. If it does not, you do not. Everything else is decoration.
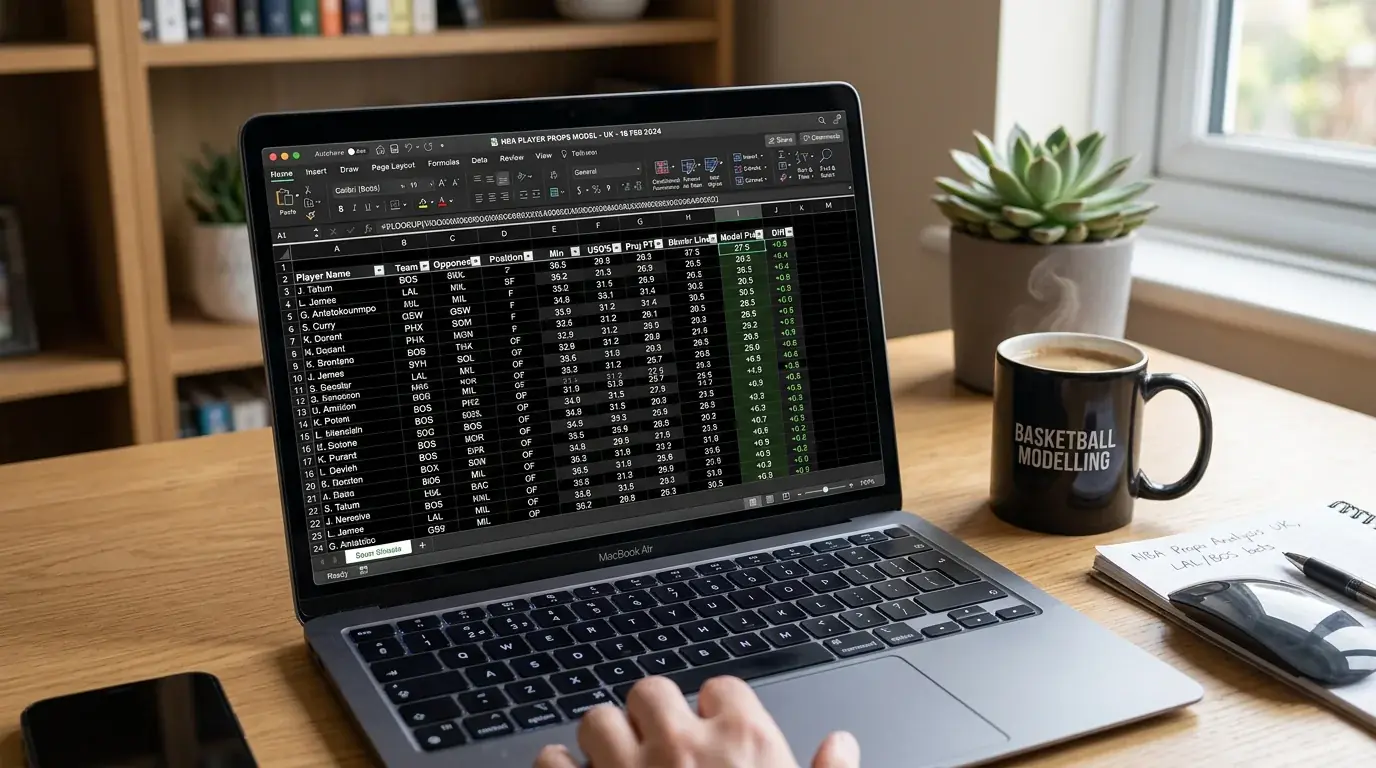
The minimum viable model fits in a single spreadsheet and uses four inputs: rolling average minutes, rolling average per-minute production for the stat, opponent defensive rating against the position, and pace projection for the game. Take last 10 games, weight recent slightly heavier than older, adjust for the matchup, project. That is it. That is the whole thing.
I built models with eighteen variables for three years. They were marginally more accurate than the four-input version and substantially harder to maintain. Eventually I cut the model back. Performance did not collapse. The lesson: more variables in NBA prop modelling almost always overfits. You are not predicting the weather, you are predicting the next 38 minutes of a basketball game played by a specific person whose recent history tells you 80 percent of what you need to know.
The pace problem and why it matters more now
Pace in the 2025-26 NBA season is running at 101.9 possessions per 48 minutes, the highest mark in three decades, and scoring averages 117.7 points per game. Those numbers are not arbitrary trivia. They are the denominators of every player prop projection. If you are using a points-per-possession assumption built on data from the slower late-2010s, you are systematically underprojecting modern player lines.
This is one of the easiest places for a UK bettor to gain an edge. Many recreational punters anchor their expectations to player career averages, which compress decades of data with very different pace environments. The bookmaker model knows the current pace environment. You either match that knowledge or you give it away. There is no third option.
Practical fix: only use the current season’s per-possession data, and adjust your pace projection per-game using the season averages of the two teams playing. A game between two top-five pace teams should be projected to run 8 to 12 possessions per side higher than a game between two bottom-five pace teams. That 10-possession swing changes a 25-point projection into a 27.5-point projection. The line you are betting against is 25.5. The edge appears or disappears entirely based on whether you handled pace correctly.
Defensive matchup is half the model
I want to push back on something that gets repeated in betting content: that defensive matchups in the modern NBA do not matter because everyone scores against everyone. The data does not support that. Position-specific defensive ratings still range across about 12 points of efficiency from best to worst defensive teams, and that range expands further when you isolate specific matchups – wing on wing, guard on guard, big on big.
What has changed is that team-level defensive rating tells you less than it used to. You need to look at the specific player who is going to be guarding your prop subject for 60 percent of the minutes. If the team’s best perimeter defender is matched up on your guard, the projection comes down. If that defender is in foul trouble, dealing with personal issues, or being rested in a back-to-back, the projection goes up.
This level of granularity is where the work pays off. The book is projecting on team-level matchup data because their models cover 25 sports. You are projecting one game. Your information advantage is depth on one matchup, not breadth across the league. Exploit it.
Where the soft lines actually are
Player rebounds and assists are softer than points across every UK book I have used. The pricing models the books deploy are tighter on points because points are the most heavily bet stat – high volume drives line accuracy. Lower-volume markets get less attention from the trading teams, and the lines reflect that.
This is true in particular for secondary players. The starting point guard’s points line will be sharp. The third guard’s rebounds line, on the same team, on the same night, may be off by a full rebound. Whose model has more data on the third guard? Theirs has more data overall. Yours can have more recent, more specific, more relevant data.
I run my projections across about 40 player-stat combinations per night and bet maybe four of them. The rest are inside the bookmaker’s margin or actually on the wrong side of fair value. The hit rate of finding bettable edges is roughly 10 percent of the props I project, and that ratio has been consistent for years. Anyone telling you they have edges on 50 percent of the prop board is either selling something or testing on insufficient sample size.
The role of context the model cannot see
A model that does not adjust for context is worse than a coin flip on certain nights. The night Adam Silver acknowledged in late 2025 that the league had asked partner sportsbooks to pull back specific props “especially when they’re on two-way players – guys who don’t have the same stake in the competition – where it’s too easy to manipulate something that seems small and inconsequential” was a moment that should have changed how every prop modeller thinks about edge cases.
Translation: if a player is on a low salary, near the end of a contract, or operating on a two-way deal, the assumption that they will play out 38 minutes of basketball trying their hardest is sometimes wrong. The book knows this and has pulled some markets entirely. Your model needs to know it too.
Pre-game checks I run on every prop I bet: starter status confirmed, no late-breaking injury news on the player or their key defender, no rest decision pending, no personal news that has hit reporters. Five minutes of checking saves the hundred-pound mistakes. Skipping that check is how recreational bettors give back six months of edge in a single bad weekend, which is why I make a habit of cross-referencing the late-breaking injury report sources that British bettors should be watching before any prop wager goes in.
Validation and the part nobody wants to do
Track every single prop bet you place. Not just whether it won or lost – the projection, the line, the closing line if you can capture it, and the result. This is the data that tells you whether your model is actually any good, and most bettors refuse to do it because the results are usually humbling.
What you are looking for over a sample of at least 200 bets: does your projection consistently beat the closing line? If it does, you have an edge whether the bets won or lost in the short term. Variance dominates everything in samples under about 500 bets, but closing line value (CLV) is signal that survives variance. If your projection systematically projects 26 points when the closing line moves from 24.5 to 25.5, you are picking up half a point of edge per bet. That compounds.
If your projection does not beat the close, you do not have a model – you have a hobby. There is no shame in that. There is enormous shame in pretending it is something else for three years while losing 8 percent of your bankroll annually.
What a small, sharp UK-based operation looks like
I run my prop model from a laptop, in spreadsheets, with three browser tabs open during pre-game prep. I do not subscribe to data services. The publicly available stat lines, combined with watching the games and reading injury reports, gives me everything I need for the limited menu of bets I make. I bet maybe 12 props a week during the regular season, with strict unit sizing, and I have a closing-line tracker that has been running for four seasons.
The whole operation could be replicated by someone competent with a spreadsheet in about three weekends. The barrier is not technical. The barrier is the discipline of trusting a simple model, doing the validation work, and not chasing the high of betting more than the edge supports. UK NBA prop betting rewards bettors who treat it like a craft and punishes the ones who treat it like a slot machine. The market does not know which kind you are. Your bankroll will eventually find out either way.
Do I need expensive data subscriptions to model NBA props?
No. Free public stat sources cover everything a basic model needs: minutes, per-minute production, opponent defensive rating, and pace. The edge comes from how you use the data, not how much you pay for it.
Which prop markets are softest on UK books?
In my experience, rebounds and assists are softer than points, especially for secondary players. Lower-volume markets receive less attention from trading teams, so the pricing is rougher.
How many bets do I need before I know my model is working?
At least 200 to see signal, ideally 500 or more before drawing firm conclusions. Focus on whether your projection beats the closing line rather than win-loss record in small samples.
Created by the ”nba bet of the day” editorial team.